A Floodplain Boundary Looks Precise Until the Water Arrives
Most selected Harvey marks intersected current SFHA geometry. The harder question is the small outside-SFHA set that was both deep and far from the mapped boundary.
Flood maps do not only describe risk. They teach people where to stop worrying. That is why the edge of the mapped floodplain matters: to a planner, it is a regulatory and modeling boundary; to a buyer, lender, reporter, or homeowner, it can sound like a verdict.
Scope note: this compares selected Harvey high-water marks with present-day FEMA NFHL context. It is not a reconstruction of 2017 effective FIRM panels, a parcel determination, a flood-depth model, or insurance advice.
Harvey is useful because it left behind an unusually strong public record. The National Hurricane Center reported rainfall above 60 inches near Nederland and Groves, Texas. USGS and FEMA later collected 2,123 high-water marks and used those observations with streamgage data to produce 19 flood-inundation maps for selected areas. A high-water mark is a peak clue, not a stopwatch: it can show how high water reached at one evidence location, but not how long water stayed there.
So the question here is narrower: when selected Harvey high-water marks are compared with present-day FEMA National Flood Hazard Layer (NFHL) context, where does mapped Special Flood Hazard Area (SFHA) context overlap the evidence, and where does the evidence deserve a second look?
The Short Version
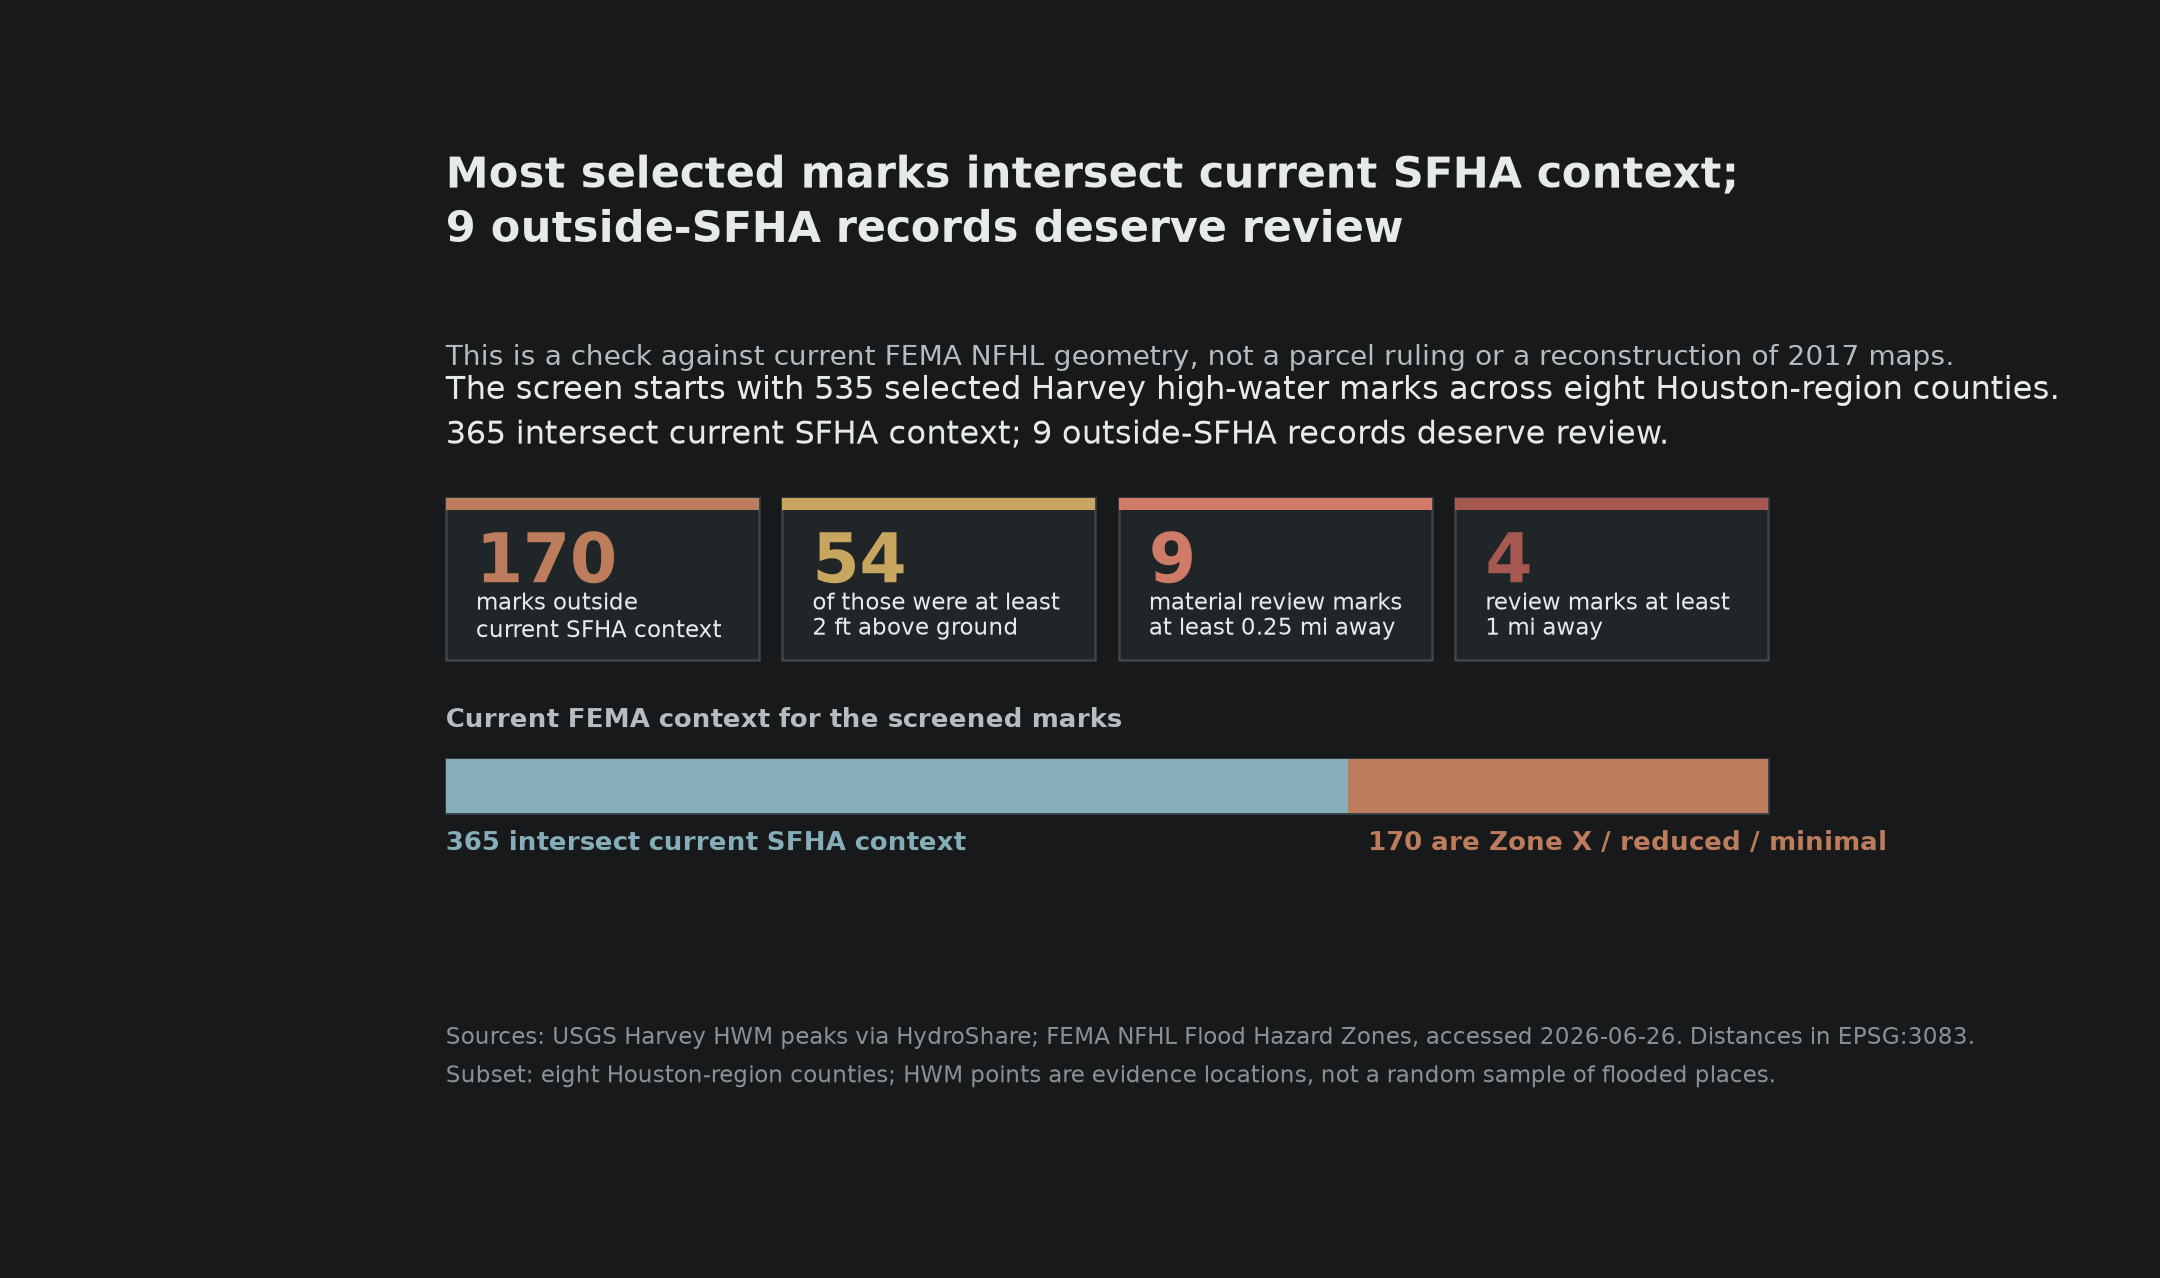
I screened 535 Houston-region USGS Harvey peak high-water marks against present-day FEMA NFHL flood-hazard context. The first result is less dramatic than a headline version would suggest: 365 of 535 marks, about 68%, intersect current SFHA context. The present-day map context overlaps a lot of this slice.
The harder question starts with the 170 marks that fall in Zone X, reduced-risk, or minimal-context areas. But 133 of those 170, about 78%, were within 0.25 miles of current SFHA geometry.
The review set is smaller: 9 outside-SFHA marks, 1.7% of the full screen, were both at least 2 ft above ground and at least 0.25 miles from current SFHA geometry. Excluding estimated-stage records narrows that queue to 3 records, or 0.6% of the full screen. The denominator keeps the claim small: this is a short list of places where mapped context and observed evidence need to be read together.
The Map View
Read the map as a comparison tool. Start wide: the regional pattern shows that much of the outside-SFHA evidence hugs the mapped boundary. Then zoom in: the question becomes local, record by record. Grid color is a low/moderate/high stress class derived from the maximum source height_above_ground_ft in each coarse cell; the point popups carry the record-level details.
Methods Snapshot
- Source HWM layer
- USGS Harvey high-water mark peaks via CUAHSI HydroShare WFS, retrieved 2026-06-26.
- Source count used here
- The HydroShare
USGS_Harvey_HWM_PeaksWFS layer returned 1,258 peak point features before county filtering. Broader USGS/FEMA reporting cites 2,123 Harvey high-water marks across the full collection; this article does not reconcile non-peak, duplicate, supplemental, or differently published mark records. - Houston-region subset
- 535 marks in Brazoria, Chambers, Fort Bend, Galveston, Harris, Liberty, Montgomery, and Waller counties.
- FEMA context
- FEMA NFHL Flood Hazard Zones point query, retrieved 2026-06-26.
- Distance method
- Point-to-nearest-current-SFHA distance, calculated after projecting the data to EPSG:3083.
- Height field
height_above_ground_ftfrom the HWM peak record; no DEM-derived height was calculated for this screen.- Review thresholds
- At least 2 ft above ground, at least 0.25 miles from current SFHA, and at least 1 mile from current SFHA. These are review screens, not regulatory thresholds.
The outside-SFHA group mixes several current NFHL contexts. In this run, the 170 records break into 99 area-of-minimal-hazard records, 66 0.2% annual-chance records, and 5 reduced-risk-due-to-levee records. Zero-height records were retained as source observations and remain in the 535-mark/context counts, but they do not pass any depth screen. Estimate flags are visible rather than filtered away: in this subset, 393 of 535 records have estimated stage and 532 of 535 have estimated time. That limitation is large enough to shape the tone.
Most Harvey Evidence In This Screen Fell Inside Current SFHA Context
The first result is ordinary, and that matters: most screened marks intersect current SFHA context.
| Group | Count | Share of 535 | Median height | At least 2 ft | Estimated stage |
|---|---|---|---|---|---|
| Inside current SFHA | 365 | 68.2% | 1.97 ft | 181 (49.6%) | 270 (74.0%) |
| Zone X / reduced / minimal context | 170 | 31.8% | 1.07 ft | 54 (31.8%) | 123 (72.4%) |
This table does two useful things. It shows that current SFHA context overlaps most of the screened marks, and it shows that the outside-SFHA group had lower median observed height in this screen. Estimated peak time is nearly universal in this source: 532 of 535 records.
The better read is narrower: most evidence intersected the present-day mapped high-risk context, while a smaller outside-SFHA tail still deserves inspection.
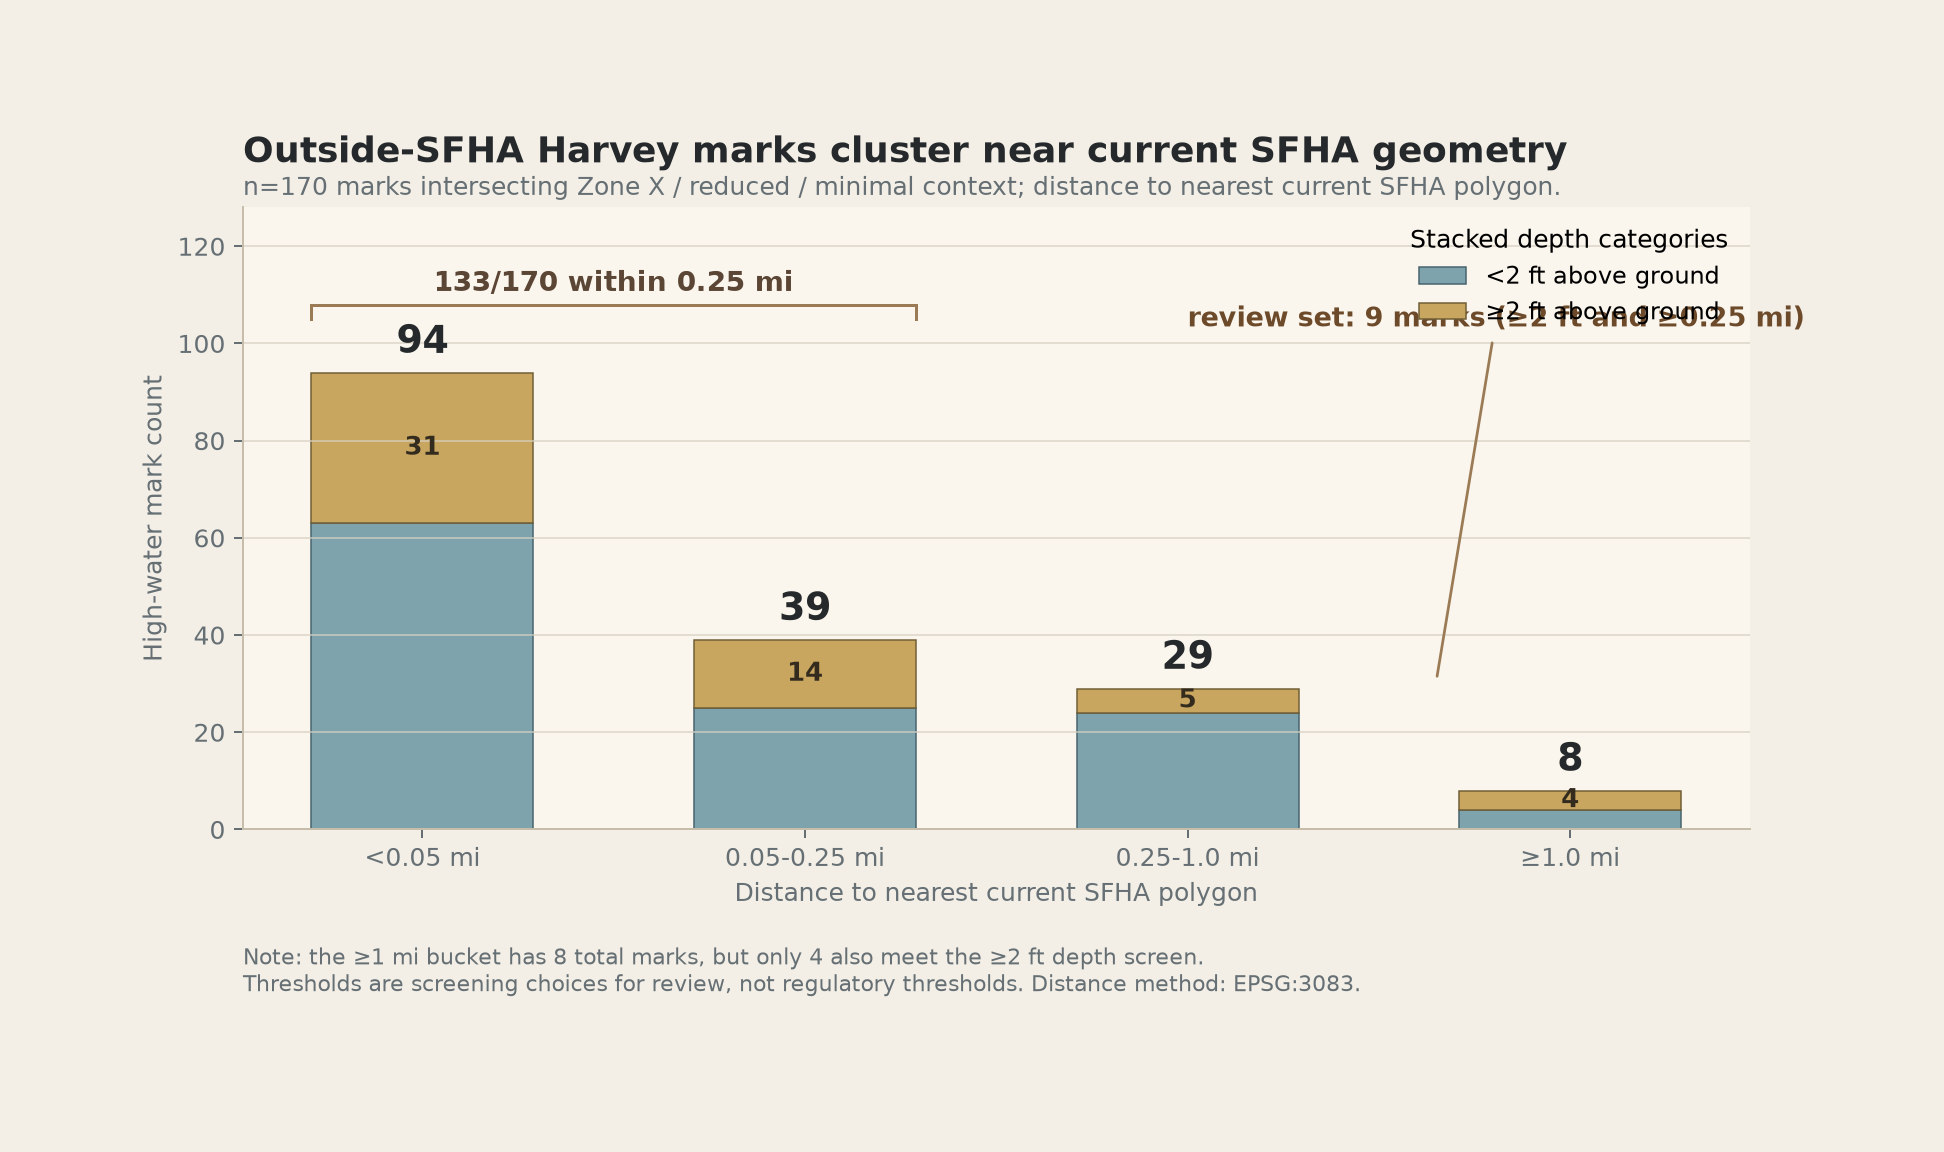
Distance buckets for the 170 Harvey high-water marks that intersect current Zone X / reduced / minimal context. The ≥1 mile bucket has 8 total marks, but only 4 also meet the ≥2 ft depth screen.
Among outside-SFHA records within 0.25 miles of current SFHA, 45 of 133 had at least 2 ft above ground. Among records at least 0.25 miles away, 9 of 37 did. The farther-out group was not proportionally deeper; it matters because distance changes the risk-communication problem.
Where They Pulled Apart
Distance alone overstates the issue. A far mark with inches of water is a different signal from a far mark with several feet, so the useful review set is the upper-right corner of the plot.
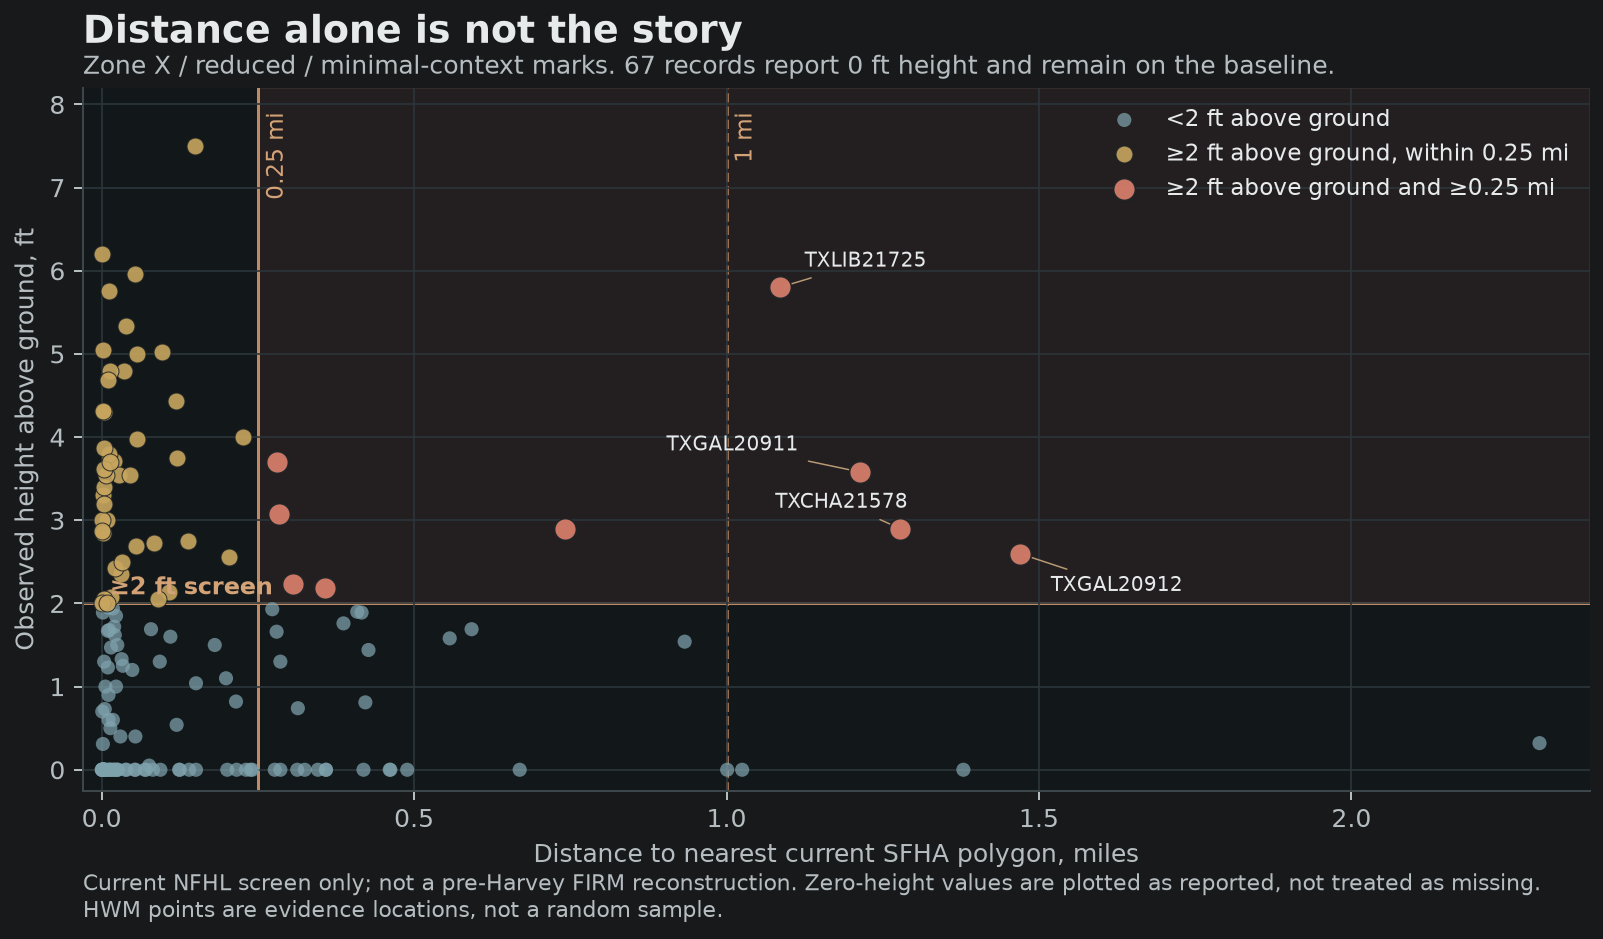
Distance alone is not the story. The upper-right quadrant marks the review set: at least 2 ft above ground and at least 0.25 miles from current SFHA geometry.
The threshold check matters because the tail is sensitive to how much water you require before calling a record material.
The review set is real, but threshold-sensitive, so the cutoffs should be read as review choices rather than findings.
| Depth screen | Outside-SFHA marks | At least 0.25 mi from SFHA | At least 1 mi from SFHA |
|---|---|---|---|
| At least 1 ft | 88 | 19 | 4 |
| At least 2 ft | 54 | 9 | 4 |
| At least 3 ft | 34 | 4 | 2 |
| At least 4 ft | 16 | 1 | 1 |
The signal is visible at 1-2 ft, but it narrows quickly as the depth threshold rises. By 4 ft, it is essentially a single-record lead. At the 2 ft threshold, the nine-record review set is 5.3% of the outside-SFHA group and 1.7% of the full 535-record screen.
The Nine Records I Would Inspect First
These nine records are the farther-and-deeper review set in this screen: places where observed Harvey evidence and current mapped context are far enough apart to justify closer review.
| HWM ID | County | Waterbody / source label | Current NFHL context | Height | Distance | Stage est.? |
|---|---|---|---|---|---|---|
TXGAL20912 |
Galveston | Cloud Bayou | minimal hazard | 2.60 ft | 1.469 mi | yes |
TXCHA21578 |
Chambers | Oyster Bayou | 0.2% annual chance | 2.90 ft | 1.278 mi | no |
TXGAL20911 |
Galveston | Cloud Bayou | 0.2% annual chance | 3.58 ft | 1.214 mi | no |
TXLIB21725 |
Liberty | Ditch (source label) | minimal hazard | 5.80 ft | 1.085 mi | yes |
TXHAR22784 |
Harris | Buffalo Bayou | minimal hazard | 2.90 ft | 0.741 mi | yes |
TXHAR21558 |
Harris | Bear Creek (Bear Cr in source) |
minimal hazard | 2.18 ft | 0.357 mi | no |
TXHAR21427 |
Harris | Cypress Creek | minimal hazard | 2.23 ft | 0.307 mi | yes |
TXHAR22752 |
Harris | Cedar Bayou | 0.2% annual chance | 3.08 ft | 0.284 mi | yes |
TXLIB22073 |
Liberty | West Branch Devers Canal | 0.2% annual chance | 3.70 ft | 0.280 mi | yes |
The nine-record set is not concentrated in one county: four are in Harris, two in Galveston, two in Liberty, and one in Chambers. All nine have estimated peak-time flags; six have estimated-stage flags.
If estimated-stage records are excluded from the full screen, the review set drops from 9 to 3 records at the 2 ft / 0.25 mi threshold, and from 4 to 2 records at the 2 ft / 1 mi threshold. That makes the tail narrower and more uncertain, which is why I treat these records as inspection leads.
What This Means For Risk Communication
The practical problem is simpler: for many readers, the map is the only risk language they are given. In this screened Harvey subset, “outside the high-risk zone” can sound like “safe enough.” The field evidence shows why that message needs qualifiers, especially near boundaries and in the small set of places where evidence sits well beyond them.
For insurance, planning, journalism, and public communication, the useful output is a short, inspectable list of places where mapped context and observed evidence should be read together.
Where This Lands
The useful lesson is not that the map failed. The useful lesson is that a boundary is a communication device. The next pass should compare these records with the effective pre-Harvey FIRM panels where available, analyze the outside-SFHA subtypes separately, and add duration context from gauges or other time-aware records.
Reproducibility Note
The current analysis uses present-day FEMA NFHL geometry as a reproducible screen. It does not reconstruct every effective pre-Harvey map panel, certify parcel risk, or provide insurance, engineering, emergency, or property advice.
References
National Hurricane Center. (2018). Tropical Cyclone Report: Hurricane Harvey. https://www.nhc.noaa.gov/data/tcr/AL092017_Harvey.pdf
U.S. Geological Survey. (2018). Post-Harvey Report Provides Inundation Maps and Flood Details on “Largest Rainfall Event Recorded in US History”. https://www.usgs.gov/news/national-news-release/post-harvey-report-provides-inundation-maps-and-flood-details-largest
U.S. Geological Survey. (2018). Characterization of peak streamflows and flood inundation resulting from Hurricane Harvey. https://pubs.usgs.gov/publication/sir20185070
CUAHSI HydroShare. Hurricane Harvey flood data collection resources. https://www.hydroshare.org/resource/615d426f70cc4346875c725b4b8fdc59/
Federal Emergency Management Agency. National Flood Hazard Layer. https://www.fema.gov/flood-maps/national-flood-hazard-layer
National Flood Insurance Program. Flood Map Zones. https://www.floodsmart.gov/flood-map-zone
U.S. Geological Survey. High-Water Marks and Flooding. https://www.usgs.gov/media/images/high-water-marks-give-evidence-peak-river-height-a-flood
Comments